Unified multi-cluster visibility: Learn how we built a centralized observability stack for Kubernetes using VictoriaMetrics, Grafana, and Loki.
From Prometheus to VictoriaMetrics: Discover why we switched to VictoriaMetrics for better scalability, performance, and cost efficiency.
Open-source power, enterprise results: Achieve production-grade Kubernetes observability without paid tools like Datadog or New Relic.
Introduction: Navigating multi-cluster complexity with observability
In today’s cloud-native world, applications no longer run in a single cluster. Organizations adopt multi-cluster architectures for scalability, resilience, and geographic distribution. But with this power comes complexity and the need for robust Kubernetes observability.
Imagine managing clusters across multiple regions, each hosting critical microservices. Without a unified observability setup, troubleshooting becomes a needle-in-a-haystack challenge. This is where multi-cluster monitoring proves essential for maintaining performance and uptime.
Why does multi-cluster monitoring matter for Kubernetes observability?
“More clusters, more chaos. Here’s how to stay ahead.”
Monitoring a single cluster is hard, and scaling to multiple clusters is exponentially tougher. Each cluster generates logs, metrics, and traces, creating an overwhelming data flood. Without the right observability tools, you risk missing key insights and reacting too late.
Open-source solutions like Prometheus, Grafana, Thanos, and OpenTelemetry offer cost-effective, flexible observability for Kubernetes environments, helping detect anomalies and ensure reliability across multi-cluster setups.
Our solution: From costly to cost-effective observability
“From costly to cost-effective. Our multi-cluster monitoring solution.”
After evaluating multiple Prometheus alternatives and observability stacks, we implemented a high-availability, open-source monitoring setup that could scale with our infrastructure while keeping costs in check. Here’s how we did it.
Infrastructure details
Cloud provider: Google Cloud Platform (GCP)
Container orchestration: Kubernetes
Number of regions: 4
Number of clusters: 4
Average node count: 100–150
This large-scale setup demanded a robust kubernetes observability stack that could handle high data volume without compromising performance.
The challenge: Exploring our monitoring options
Paid alternatives: Are they worth it?
“The truth about paid monitoring. Are you paying for a black box?”
Paid observability platforms like Datadog and New Relic provide seamless multi-cluster visibility but come with high costs.
Licensing fees, per-node pricing, and data retention charges quickly add up.
These black-box tools limit customization and don’t align with the flexibility modern Kubernetes environments demand.
Given our cluster size of 120+ nodes, the cost of these platforms became prohibitive. Instead of paying a premium for a one-size-fits-all solution, we chose open-source Prometheus alternatives to build a tailored observability stack.
How about open-source alternatives?
"Prometheus, Grafana & Loki: The ultimate observability trio ?”
Prometheus + Grafana + Loki form a powerful open-source solution, but they come with their own challenges:
High maintenance requirements
Lack of built-in clustering capabilities
Prometheus, designed as a monolith with local storage, is not ideal for scalable setups. However, integrations like Thanos or Cortex can enable scalability by:
Adding remote storage support (e.g., S3, GCS)
Implementing a global query layer
Making Prometheus stateless by transferring metrics (older than two hours) to remote storage
While Thanos or Cortex enable sharding and unified querying, they also add complexity. As your infrastructure scales, resource consumption increases, leading to higher operational overhead and potential performance bottlenecks. Additionally, managing long-term storage and ensuring high availability requires extra configurations, making maintenance more demanding.
So, what’s the alternative?
What did we choose for scalable Kubernetes observability?
A scalable and performance-oriented monitoring alternative: VictoriaMetrics + Grafana + Loki
VictoriaMetrics comes with built-in clustering and is fully backward compatible with all Prometheus endpoints. It emerged as the top performer in our resource and performance benchmark, which was crucial for scaling.
VictoriaMetrics overview
VictoriaMetrics, similar to Prometheus, offers built-in clustering capabilities, making it an ideal choice for our monitoring needs. It comprises:
vmagent: Scrapes Prometheus metrics using scrape configs and pushes data to the cluster.
vmcluster: Comprises three components:
vmwrite: Handles data ingestion, configured as an internal load balancer.
vmstorage: Stores data with replication and sharding for scalability.
Loki overview
Loki provides three deployment strategies, and for our setup, we opted for the Simple Deployment strategy to efficiently handle clustering. For storage, we use Google Cloud Storage (GCS) to ensure scalability and durability.`
Loki deployment consists of three main components:
Loki-Write – Handles incoming log ingestion. Exposed via an internal load balancer, allowing all clusters to connect seamlessly.
Loki-Read – Manages log querying and retrieval.
Loki-Backend – Handles indexing and storage operations with GCS.
Logging agent: Fluent Bit
For log collection, we chose Fluent Bit as the logging agent. Each log line is enriched with custom labels (Cluster: cluster 1)before being pushed to the master cluster, ensuring efficient filtering and retrieval.
This setup provides a streamlined, scalable logging solution while leveraging Loki’s simplicity and GCS’s reliability.
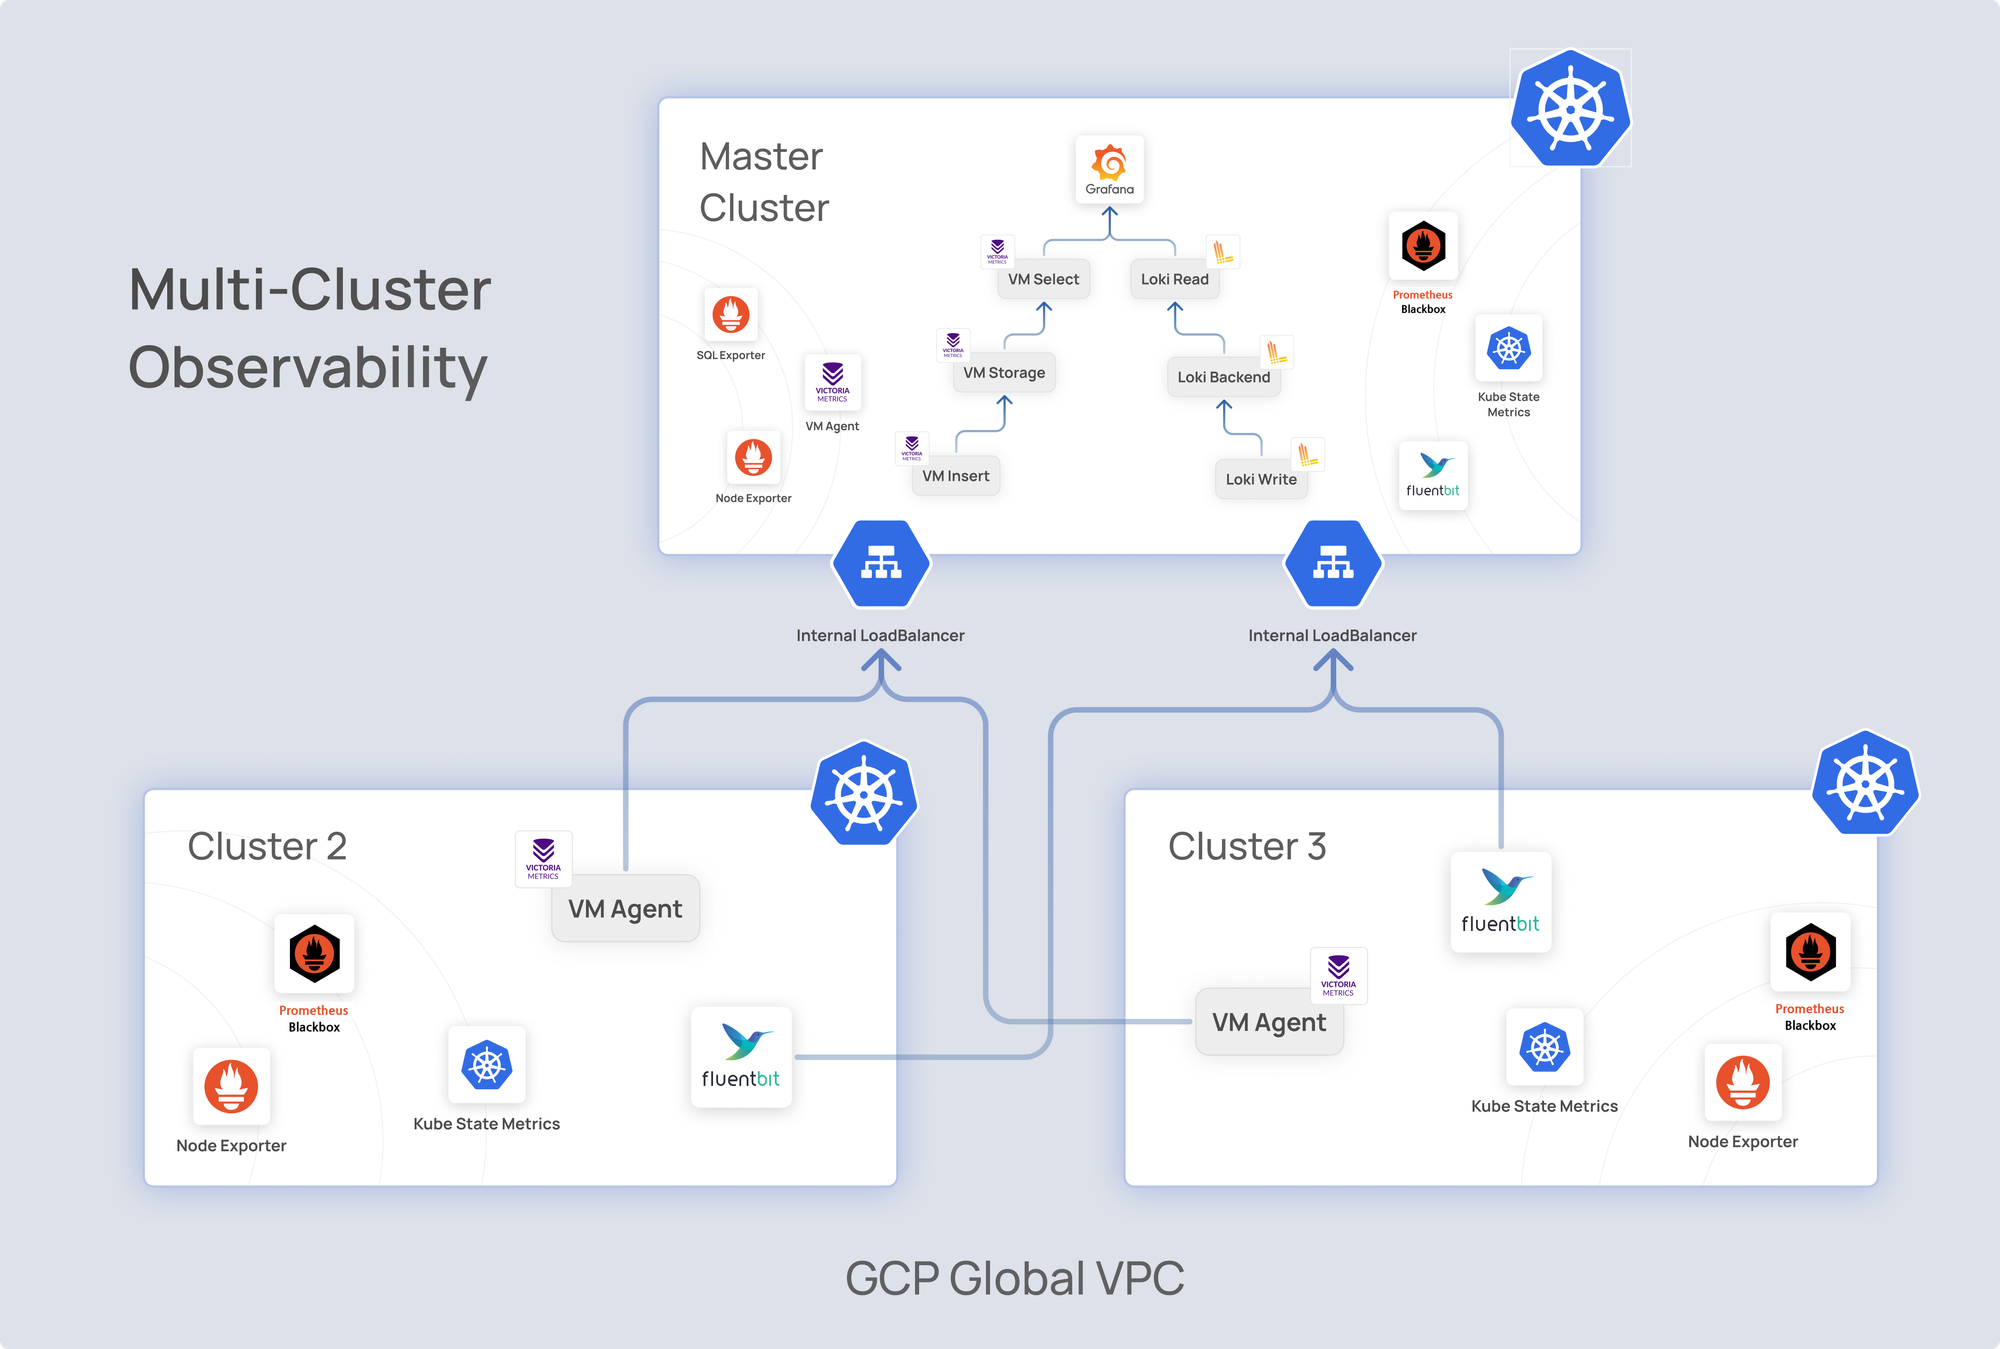
Architecture overview
“Building a high-availability monitoring stack—here’s how we did it”
Our production monitoring setup consists of three Kubernetes clusters:
Cluster 1: Master cluster (hosts the VictoriaMetrics cluster and centralized Grafana).
Clusters 2 and 3: Handle workloads and other components.
Key details:
Global VPC connectivity – All clusters communicate via a global VPC, spanning multiple subnets and regions.
Metrics collection with vmagent – Each cluster runs vmagent to collect metrics, tagging them with custom labels (e.g., clustername=cluster1) for segregation.
Additional metrics sources – Metrics are gathered from:
Logging with fluent bit – Deployed in each cluster, Fluent Bit appends custom labels similar to vmagent for structured log management.
Log ingestion via load balancer – Logs are sent to Loki-Write through an internal load balancer for centralized processing.
Implementation highlights
Data flow:
Metrics collected by vmagent in Clusters 1, 2, and 3 are sent to the vmwrite component in Cluster 1.
Logs via fluentbit is sent to Loki write in cluster 1
Grafana, hosted centrally in Cluster 1, connects to vmselect and loki read for unified monitoring dashboards.
High availability:
Replication and sharding ensure data integrity and scalability within vmstorage.
Loki is setup with proper log indexing based on k8s required labels and data is synced to GCS, and a compactor is used to handle the data retention.
Internal load balancing improves reliability and prevents bottlenecks.
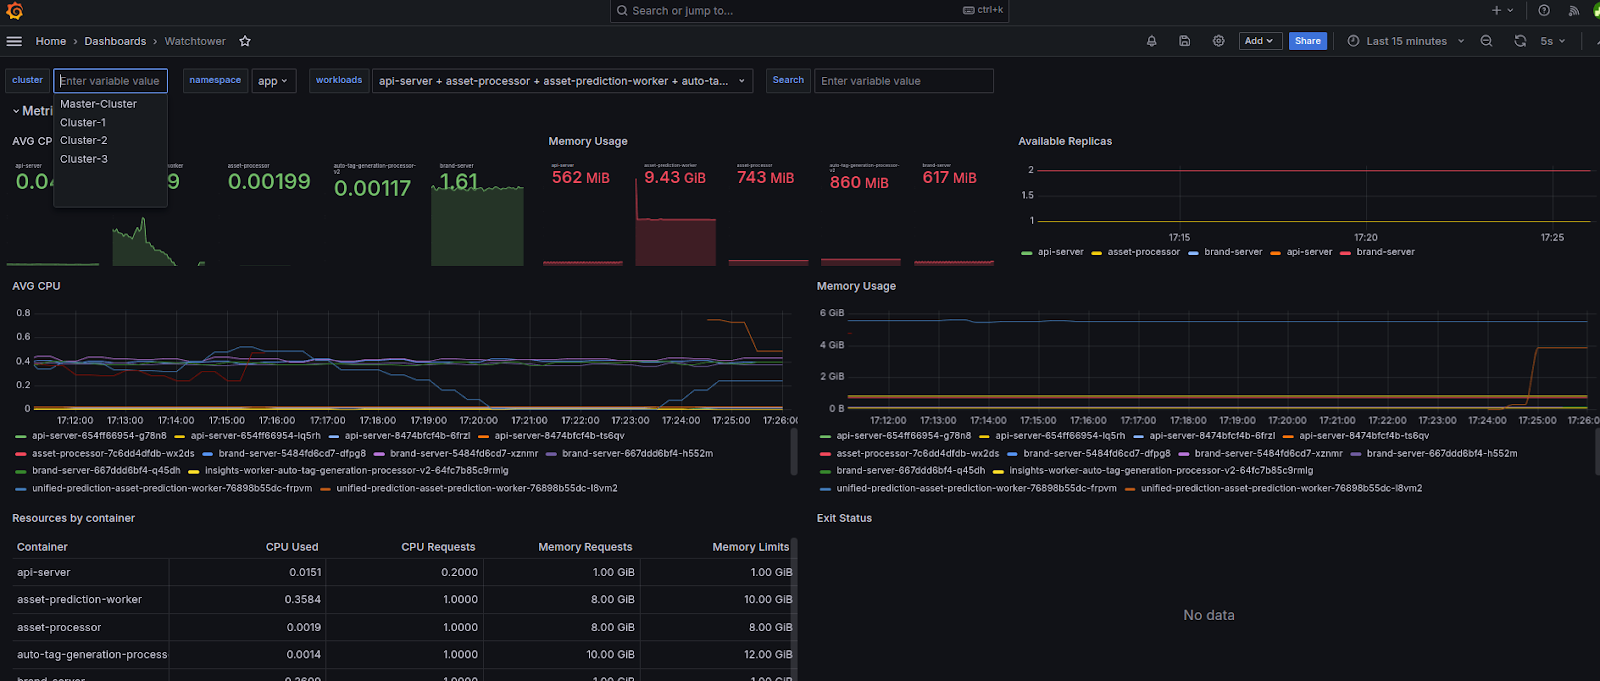
Visualization:
Centralized Grafana dashboards provide a comprehensive view of metrics and logs across clusters, enabling quick identification of issues and performance tuning.
Performance comparison
“VictoriaMetrics vs. Prometheus + Thanos: The ultimate performance face-off”
VictoriaMetrics demonstrated:
Improved query speeds: Optimized for large datasets and distributed setups.
Reduced maintenance overhead: Clustering is natively supported, unlike Prometheus.
Cost efficiency: Open-source, with lower infrastructure costs compared to paid alternatives.
1.5M TS//15S
100K SAMPLES/S
Thanos
VictoriaMetrics
CPU
4.01 cores
0.86 cores
Memory
21 GiB
8.93 GiB
Bytes/sample*
4.72 B
0.91 B
Ready to scale your Kubernetes observability?
Looking to build a high-performance, open-source observability stack that scales across clusters? Partner with KeyValue to design, implement, and optimize your Kubernetes monitoring using tools like VictoriaMetrics, Grafana, and Loki.
👉 Let’s talk about building visibility that grows with your infrastructure.
Conclusion: Open-source observability for modern Kubernetes
“Monitoring at scale? Open-source is the way forward."
By leveraging VictoriaMetrics, Grafana, and Loki, we successfully implemented a high-performing, scalable monitoring solution tailored to our needs. This setup not only ensures optimal performance but also aligns with cost and scalability requirements, making it a sustainable choice for growing infrastructure demands.
In a world where multi-cluster architectures are becoming the norm, open-source tools like these empower organizations to achieve enterprise-grade observability without the enterprise-grade price tag. So, whether you’re a startup or a large enterprise, it’s time to embrace open-source monitoring and take control of your multi-cluster environment.
Let’s turn complexity into clarity—one cluster at a time.
For anyone looking to dive deeper into the specifics of implementing this setup, a detailed VictoriaMetrics tutorial can guide you through the setup process and best practices for scaling your monitoring system across multiple clusters. Remember that mastering monitoring best practices is key to ensuring the smooth operation of your infrastructure as you grow.
Kubernetes observability is the ability to monitor, analyze, and understand the performance of applications and infrastructure across clusters. It combines metrics, logs, and traces to provide real-time visibility into system health.
2. What are the 4 pillars of observability?
The four pillars of observability are metrics, logs, traces, and events. Together, they help detect issues, analyze root causes, and maintain reliability in distributed systems like Kubernetes.
3. Is Grafana an observability tool?
Yes. Grafana is a leading open-source observability platform that visualizes metrics, logs, and traces from sources like Prometheus, Loki, and VictoriaMetrics, offering unified dashboards for performance monitoring.
4. What is observability vs monitoring in DevOps?
Monitoring tracks known system metrics and alerts on failures, while observability helps engineers explore unknown issues by analyzing system data. Observability gives deeper insight into why problems occur.
5. Which is the best observability tool for Kubernetes?
The best tool depends on scale and use case, but open-source stacks like VictoriaMetrics, Loki, and Grafana provide powerful, cost-effective Kubernetes observability compared to paid platforms.